MoreExam
1. Question Content...
EXPLANATION
Answer: X - EXPLANATION Content.
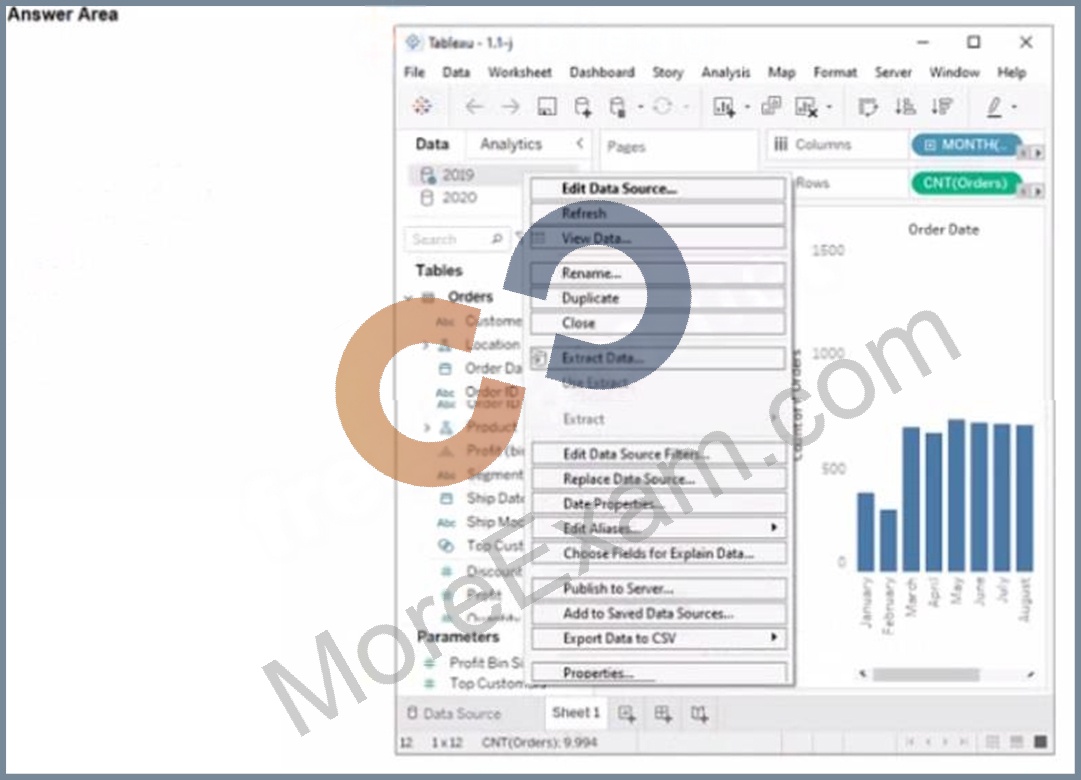
Question1: You have two data sources that use the same schema One data source contains order data from 2019 and the other data source contains order data from 2020.You have a worksheet that shows the orders from 2019.You need to configure the worksheet to show the orders from 2020 without reloading the data.Which option should you select?
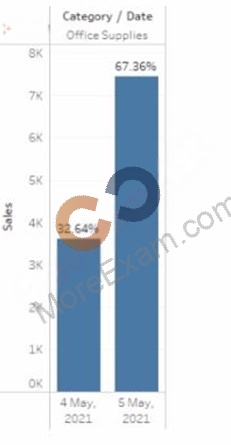
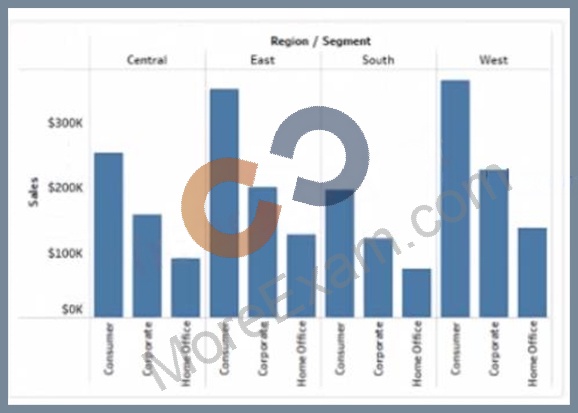
Question2: You have the following datasetYou need to create the following visualization.Which quick table calculation should you drag to Text on the Marks card?
Question3: You have a Tableau workbook.You want to make the workbook available in Tableau Online.What should you do?
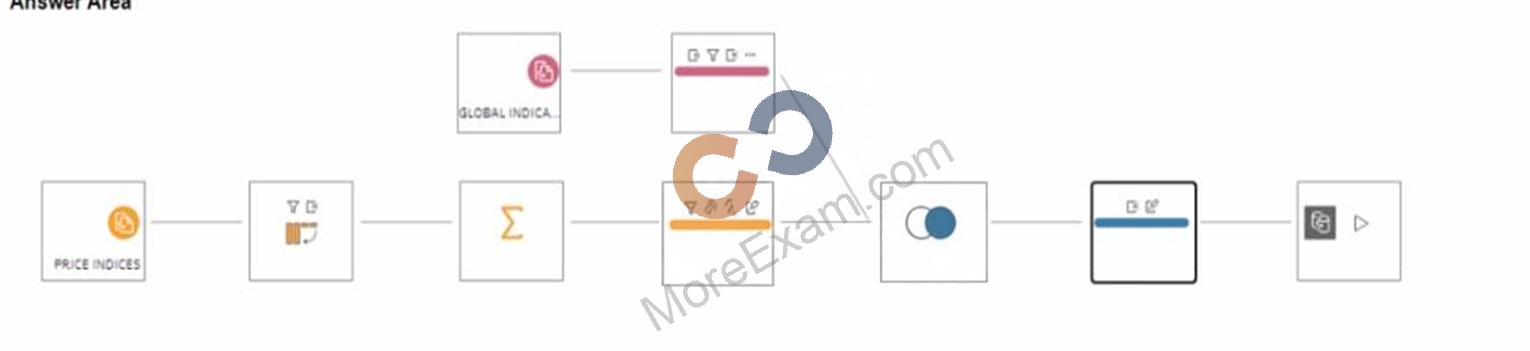
Question4: You have a Tableau Prep flow that joins a dataset named Global Indicators to a dataset named Price Indices.In which step can you transform rows of monthly data into rows of yearly data''
Question5: You have a dataset that contains sates data. The following is a sample of the data.You need to return a value of true if a month has sales greater than $50 000. otherwise the formula must return a value of false.Which two formulas achieve the goal Choose two
Question6: You connect to a database server by using Tableau Prep. The database server has a data role named Role1.You have the following field in the data.You need to apply the Role1 data role to the Material field.Which two actions should you perform? Choose two.
Question7: You have a data source that contains data tor every city in the Unites States. The following is a sample of the data.You need to use the City dimension to create a dynamic filter that snows the cities that have a population greater than one million Which type of filter should you use?
Question8: You create a parameter named Choose Region fiat contains values from a field named Region.You want users to be able to use the Choose Region parameter to interact with a chart by logging between different regions What should you do next?
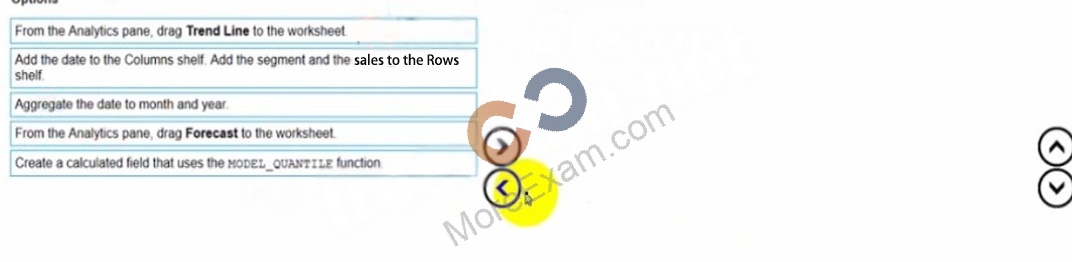
Question9: You have a dataset that contains daily sales by business segment from 2017 to the present You want to use monthly historical trends to predict sales by segment in the future Which three actions should you perform m order?(Place the three correct options in order Use the arrows to move Options lo Answer Area I In Answer Area arrows to re order the options.)
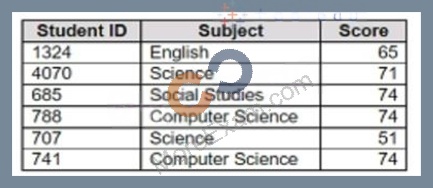
Question10: You have the following dataset.You want to create a new calculated dimension field named Category that meets the following conditions:. When Subject is Computer Science or Science, Category must be Sciences.. When Subject is English or Social Studies, Category must be Humanities.Which two logical functions achieve the goal? Choose two.
Question11: You are subscribed to several views.You need to unsubscribe from the views.What should you use?
Question12: You need to change the values of a dimension without creating a new field.What should you do?
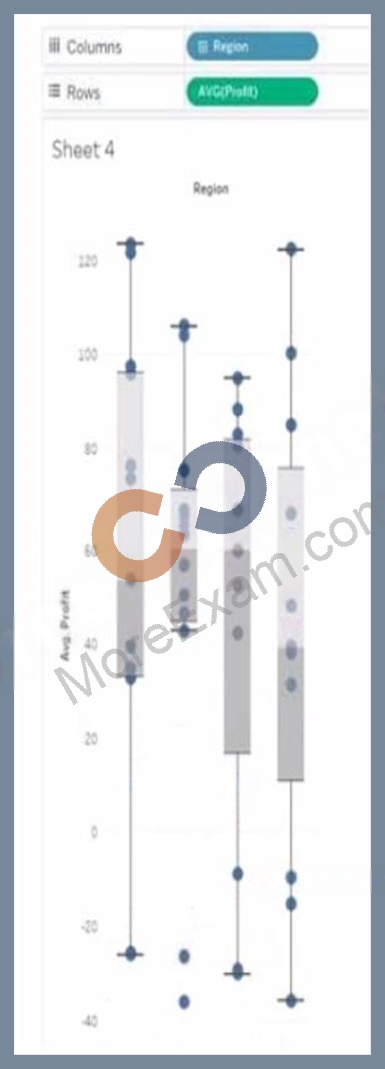
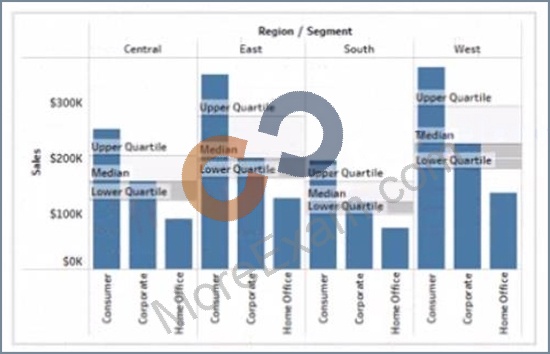
Question13: You have the following box plot that shows the distribution of average profits made in every state by region.Which region has the smallest distribution of profits?
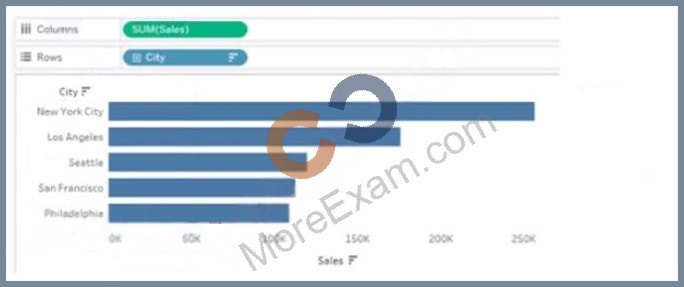
Question14: You have a database that includes field named sales, City and Region.You have the following chart that shows the number of sales made in different cities.You want to dynamically show the corresponding region when users hover their mouse over any of the bars.What should you do?
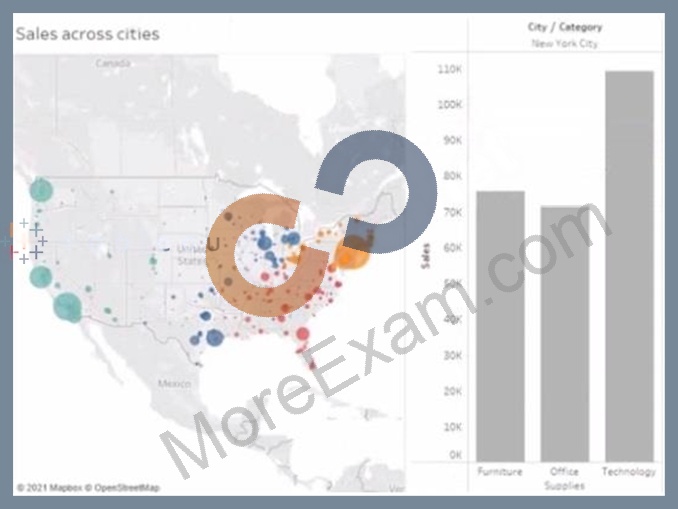
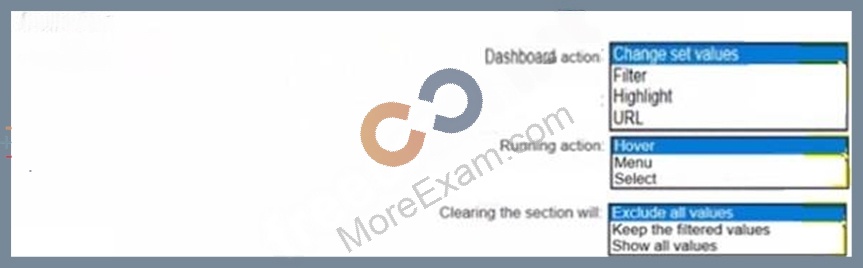
Question15: You have the following dashboard.When a user selects a only on the map the data on the bar chart must show only the data for the selected city. The data in the bar chart must change only when the user selects a different city How should you configure the dashboard action? (Use the dropdowns in the Answers Area to select the correct options.)
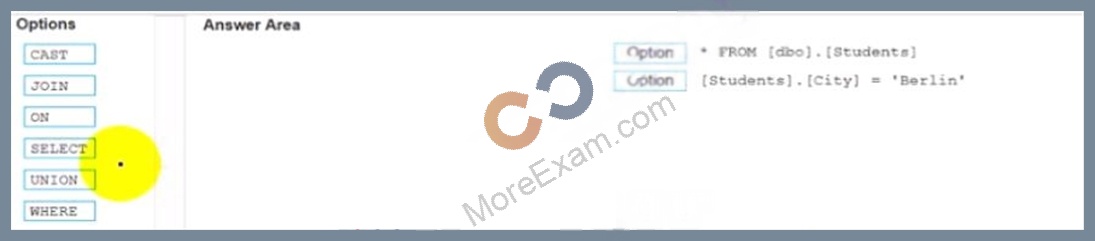
Question16: You conned to a Microsoft SQL Server databaseYou need to create a custom SQL query that retrieves rows from a table named Students Only students m the city of Berlin must be returned How should you complete the query? (Drag the appropriate Options to the Answer Area and drop into the correct locations.)
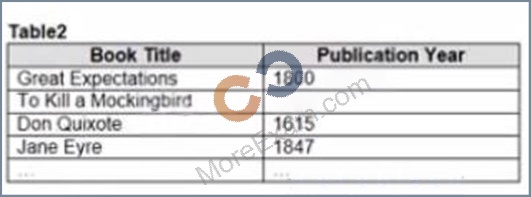
Question17: You have the Mowing two tables that contains data about the books in a library.Both tables are incomplete so there are books missing from the tables.You need to combine the tables. The solution must ensure that all the data is retained Which type of join should you use?
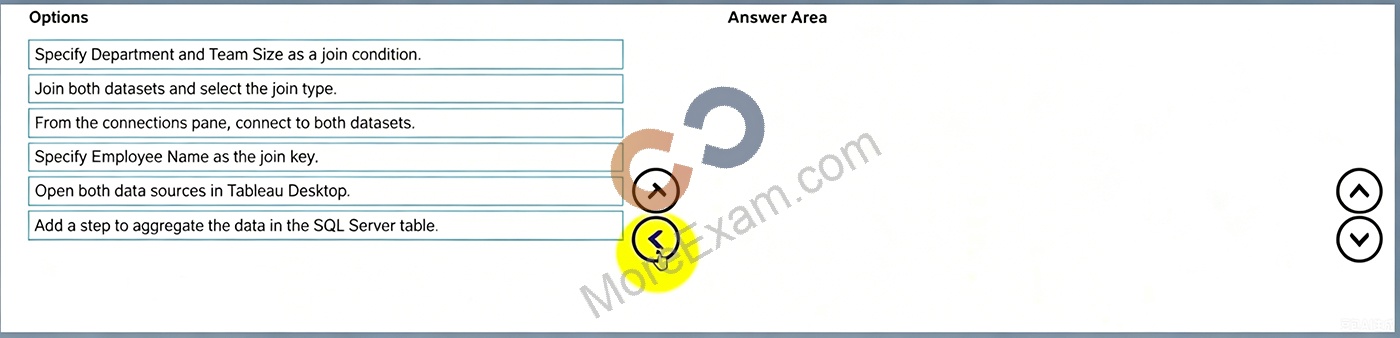
Question18: You have the following two datasets:* A Microsoft Excel worksheet that has two columns named Employee Name and Department* A Microsoft SQL Server table that has three columns named Employee Name. Pay Grade and Team Size.You want to use Tableau Prep to join the two datasets.Which three actions should you perform in order? (Place the three correct options in order.)
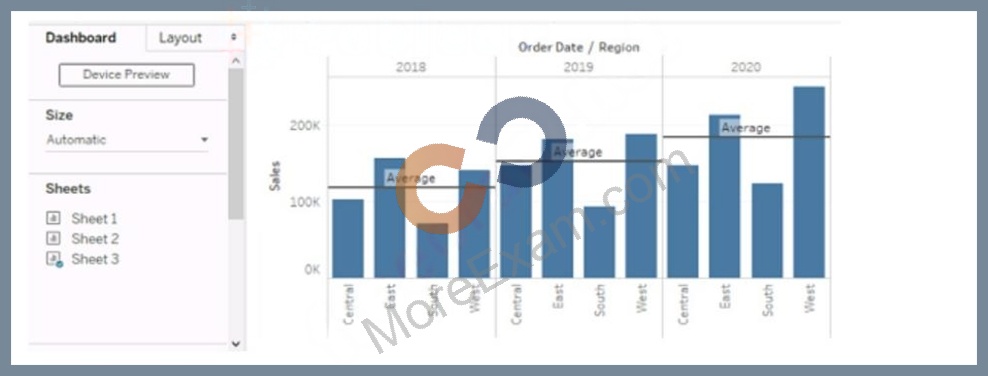
Question19: You have the following dashboard that contains two sheets.You want to minimize the whitespace between the sheets.What should you configure?
Question20: From Tableau Desktop you sign in lo a Tableau Server site.What appears in the list of available data sources when you search for a published data source?
Question21: You have the following tiled dashboard that has one sheet.You want to replace fit sheet with Sheet2.What should you do?
Question22: You have the following dashboard that contains two visualizations.You want to show only visualization at time. Users must be able to switch between visualizations.What should you me?
Question23: You want to connect a Tableau workbook to a dataset in a Microsoft Excel spreadsheet.What should you do from Tableau Desktop?
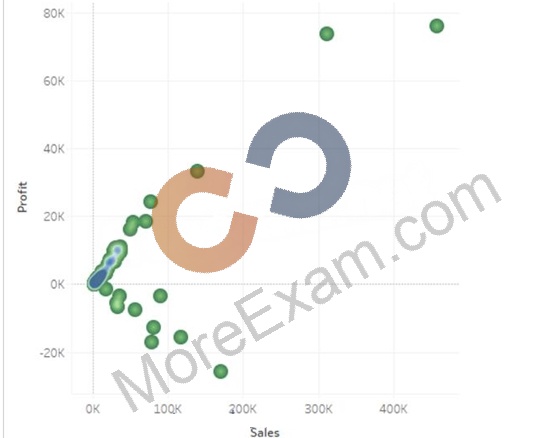
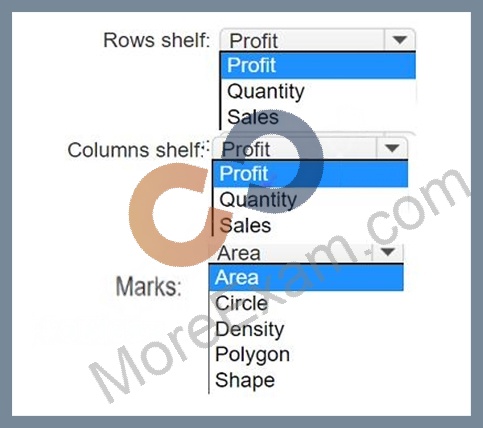
Question24: You have a data set that contains three columns named Sales, Profit, and Quantity.You need to build the following scatter plot.
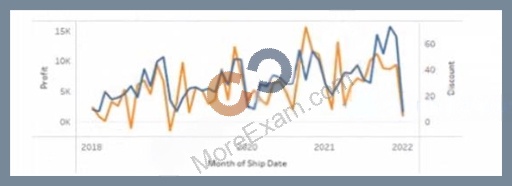
Question25: You have the following chart that shows profits and discounts over time.You need to combine the lines to appear as shown in the following chart.What should you do?
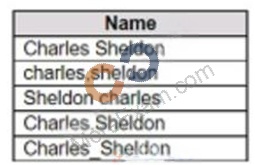
Question26: You have the following dataset:Which grouping option should you use in Tableau Prep to group all five names automatically?
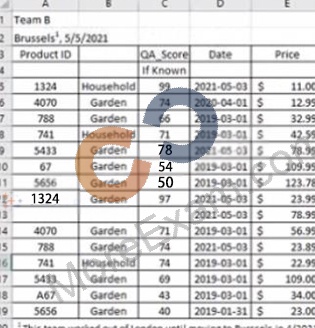
Question27: You have the following dataset in Microsoft Excel.You are using interpreter to cleans the dataset. Data interpreter provides the following results.How many rows of data will be ingested into Tableau as values?
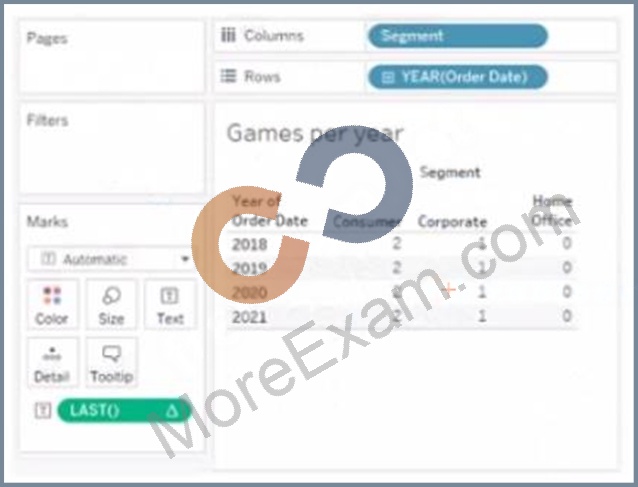
Question28: You have the following visualization.The Last() calculation is set to compute using Table (across)Which value will appear in the crosstab for the Consumer segment of the year 2018 if you change compute to use Oder Dale?
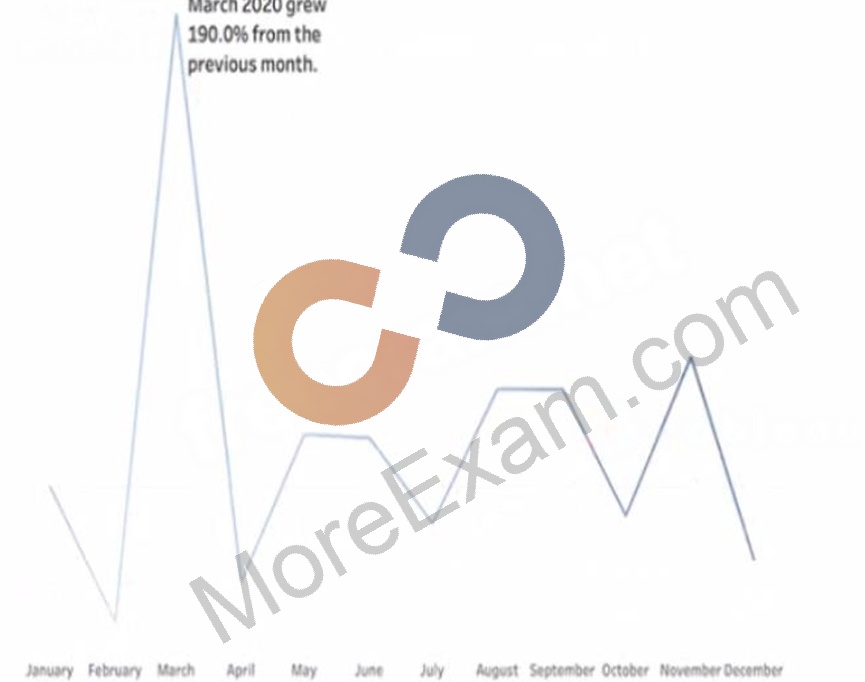
Question29: You have a line chart on a worksheet.You want to add a comment to March 2020 as shown in the following visualization.What should you do?
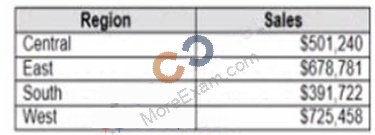
Question30: You have the following dataset.Which Level of Detail (LOD) expression should you use to calculate tie grand total of all the regions?
Question31: Open the link to Book1 found on the desktop. Open the sales dashboard.Add the Sales by State sheet in a Show/Hide button to the right side of the dashboard.
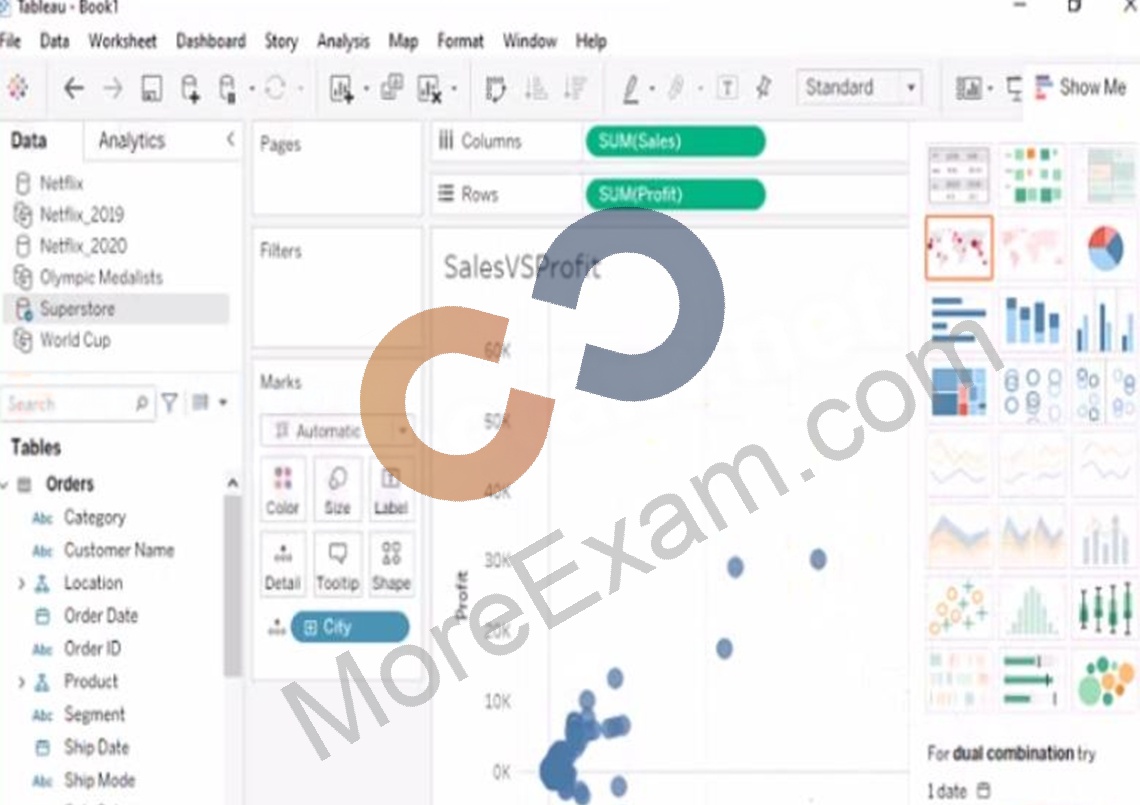
Question32: Open the link to Book1 found on the desktop. Open SalesVSProfit worksheet.Add a distribution band on Profit to show the standard deviation from- 1 to 1.
Question33: You have the following bar chart.You want the chart to appear as shown in the Mowing exhibit.What should you add?
Question34: You have the following tiled dashboard that has one sheet.You want to replace the sheet with Sheet2.What should you do?
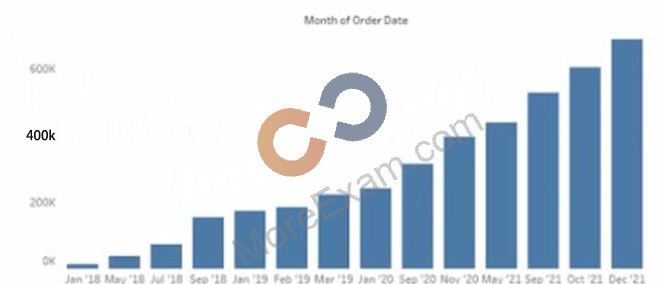
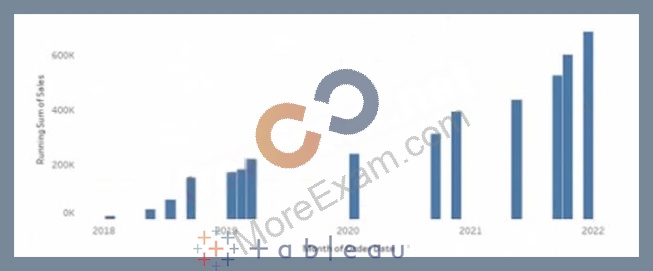
Question35: You have the following chart that shows the cumulative of sales from various dates.You want the months to appear as shown in the following chart.What should you do?
Question36: You have the Mowing dashboard.Which two elements are floating? Choose two.
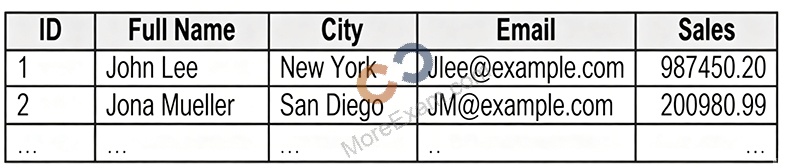
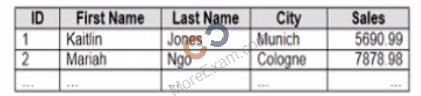
Question37: You company has two divisions located in the United States and Germany Bach division has a separate database. The following is a sample of the sales data for the division in the United States.The following is a sample of the sales data for me division in Germany.You have population data in a file named Populatio.csv. the following is a sample of the data.You plan to create a visualization that ml show tie sales per capita for each salesperson Each salesperson must be identified by identified by their full name.You need to prepare the data to support the planned visualization. The data source must support being published .Which four actions should you perform in order?(Place the four correct options n order Use the arrows to move Options to Answer Area arrows to re-order the options.Use Answer Area arrows to re-order the options)
Question38: You have the following dataset.Which grouping option should you use m Tableau Prep to group al five names automatically?
Question39: You publish a dashboard tut uses an attract. The extract refreshes every Monday at 10:00.You need to ensure that the extract also refreshes on the last day of the month at 18:00.What should you do?
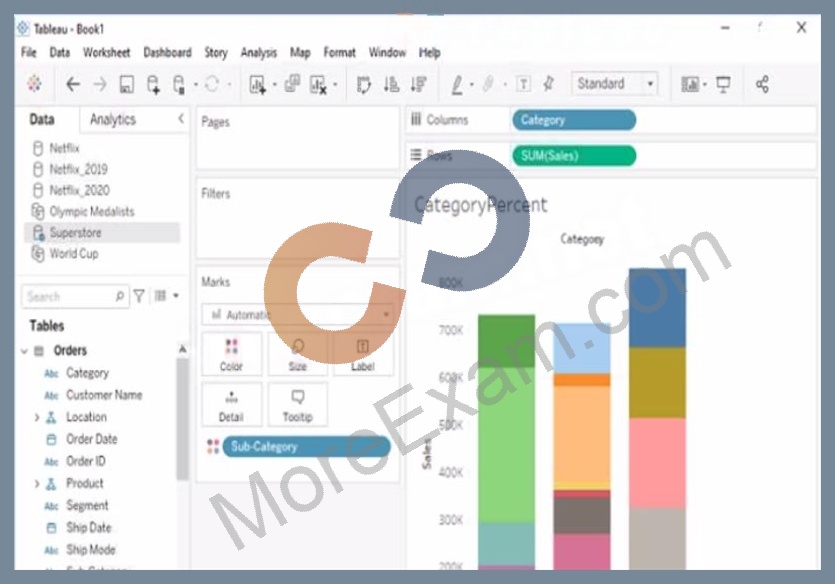
Question40: Open the link to Book1 found on the desktop. Open the CategoryPercentage worksheet.Modify the bar chart show the percentage of sales for each Subcategory within every Category. The total percentage for every Category must be 100%.
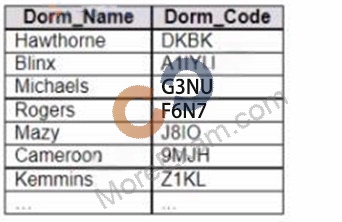
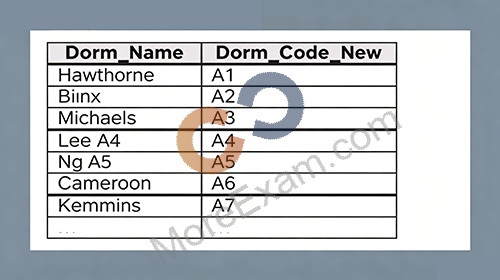
Question41: You have the following primary data source that contains a dimension named Dorm_Code.You receive the following secondary data source that contains updated dorm codes.You need to bring the updated dorm codes into Tableau and use the codes in existing visualizations. The new dorm codes must use the existing field name of Dorm_Code.What should you do?
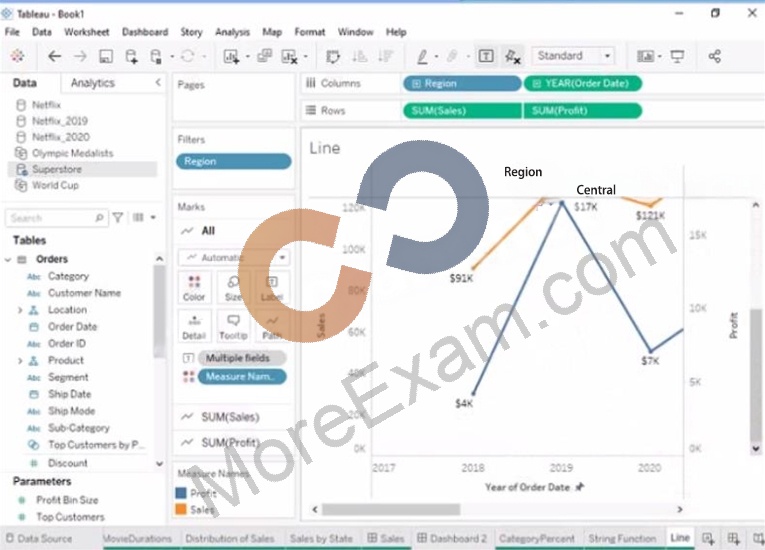
Question42: Open the link to Book1 found on the desktop. Open the Line worksheet.Modify the chart to show only main and max values of both measures in each region.
Question43: A colleague provides you with access to a folder that contains the following files:* Sates.csv* Bookl.twb* Sates.hyper* Export.mdbWhich He contains an extract?
Question44: You have a blank dashboard.You want to add two sheets to the dashboard. The sheets must support the Show/Hide button.To which two objects can you add the sheets? (Click the two appropriate Options in the Answer Area.)